Control Plane Monitoring
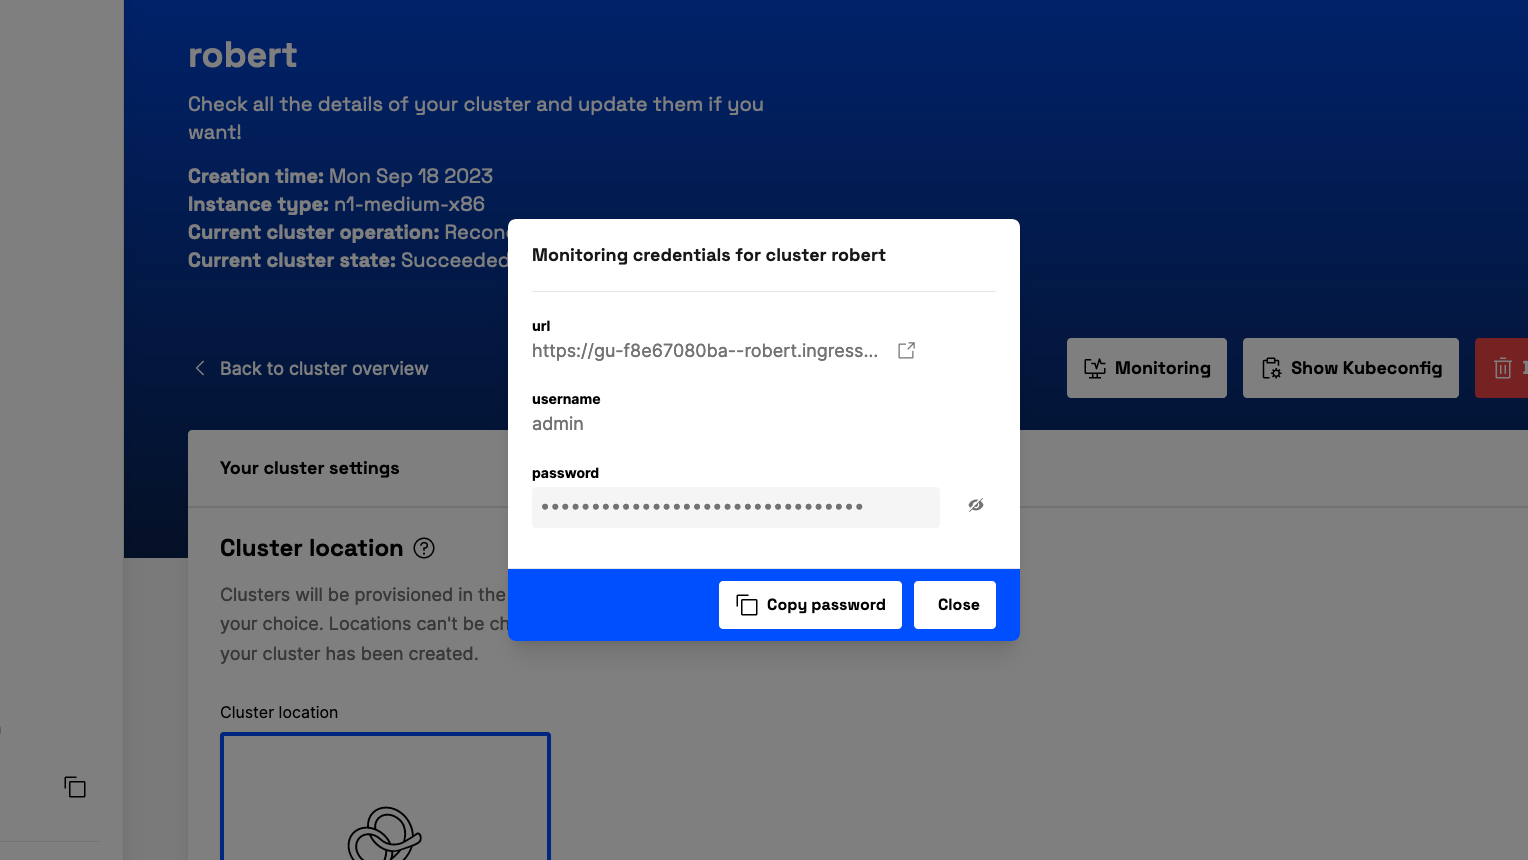
At metalstack.cloud, a unique Grafana instance for each cluster is provided to facilitate the monitoring of your cluster’s control plane. The instance can be accessed with readonly permissions.
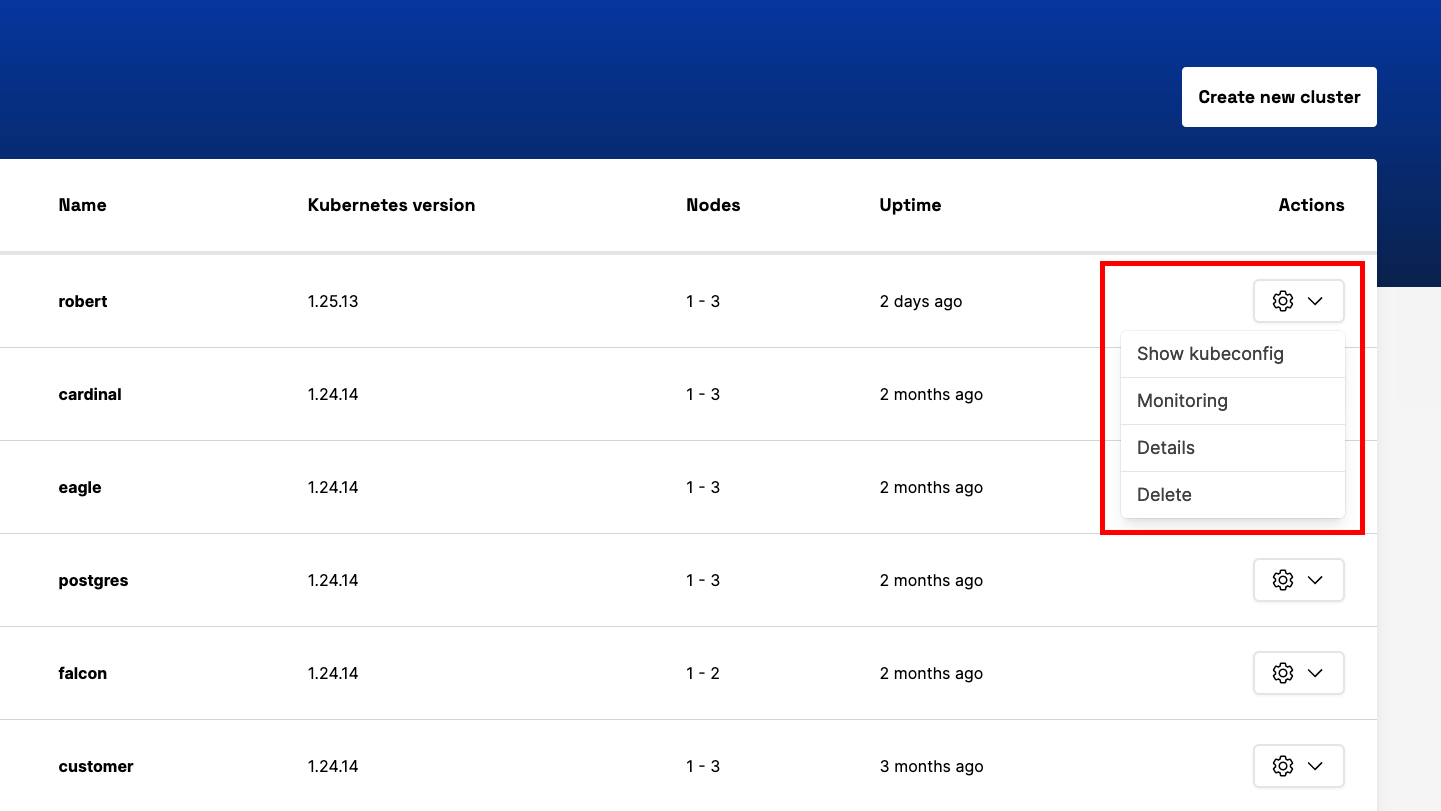
You can locate it through the overview section of your cluster:
Upon reaching it, you’ll find the URL and login credentials necessary to access the Grafana instance:
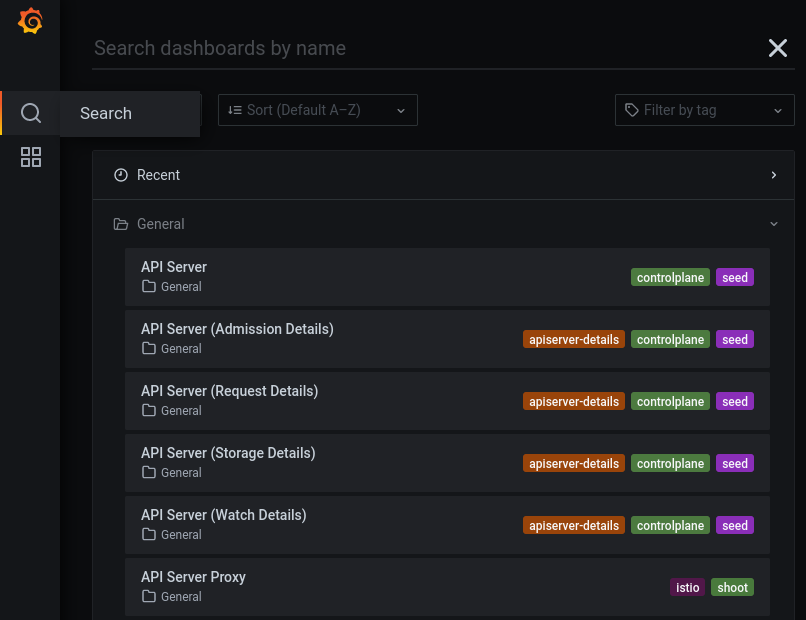
Once you’ve logged into the Grafana platform, you can easily navigate to the pre-configured dashboards by selecting the magnifying glass icon: